This module depends on the basic geo models that must exists to be monitored. Electric lines, Parcels or Point sites are models with a geo representation that can be monitored with spectral index.
Spectral indices are mathematical equations that are applied to the various spectral bands of an image per pixel. They are used to monitor Earth system dynamics such as vegetation dynamics, water bodies, and fire regimes. The rapid increase of proposed spectral indices has led to a high demand for catalogues of spectral indices and tools for their computation. A standardized catalogue of spectral indices is needed to advance the use of remote sensing in Earth system research1.
Spectral indices are combinations of the pixel values from two or more spectral bands in a multispectral image. They are designed to highlight pixels showing the relative abundance or lack of a land-cover type of interest in an image. Spectral indices can be used to extract information about specific features or properties of the Earth's surface, such as vegetation density, soil moisture, or fire risk.
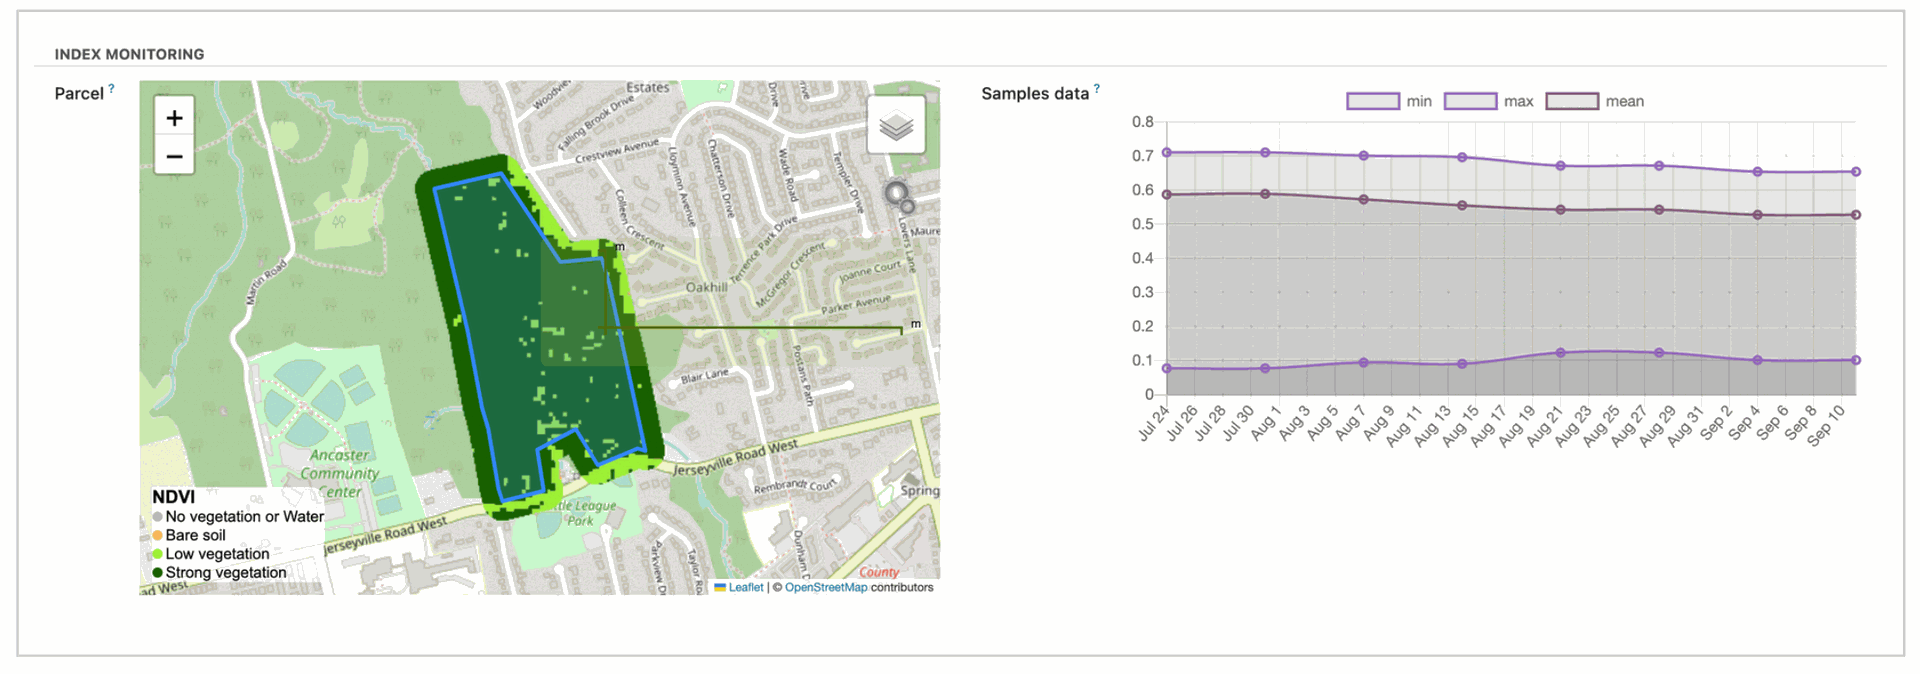
Hamilton Parks, Monitoring Normalized Difference Vegetation Index (NDVI)
Legend
Sentinel-2 is a European wide-swath, high-resolution, multi-spectral imaging missionthat can be used as Remote Sensing instrument. The Sentinel-2A and Sentinel-2B satellites carry an optical instrument payload that samples 13 spectral bands: four bands at 10 m, six bands at 20 m, and three bands at 60 m spatial resolution.
Sentinel-2 is used to support a variety of services and applications offered by Copernicus, including land management, agriculture, forestry, disaster control, humanitarian relief operations, risk mapping, and security concerns. Sentinel-2 has a revisit time of 10 days for global coverage of Earth's land surface with the first spacecraft, reducing to every 5 days once both are in orbit. The two Sentinel-2 satellites are on opposite sides of the Earth, and each revisits the same locations every 10 days, so one will visit every 5 days.
Management of multi-spectral Index
Home of the most used indices have been included in the module for their development and evaluation. The management of multi-spectral indices in the module guarantees the definition of a new index or executing adjustments on existing indices.
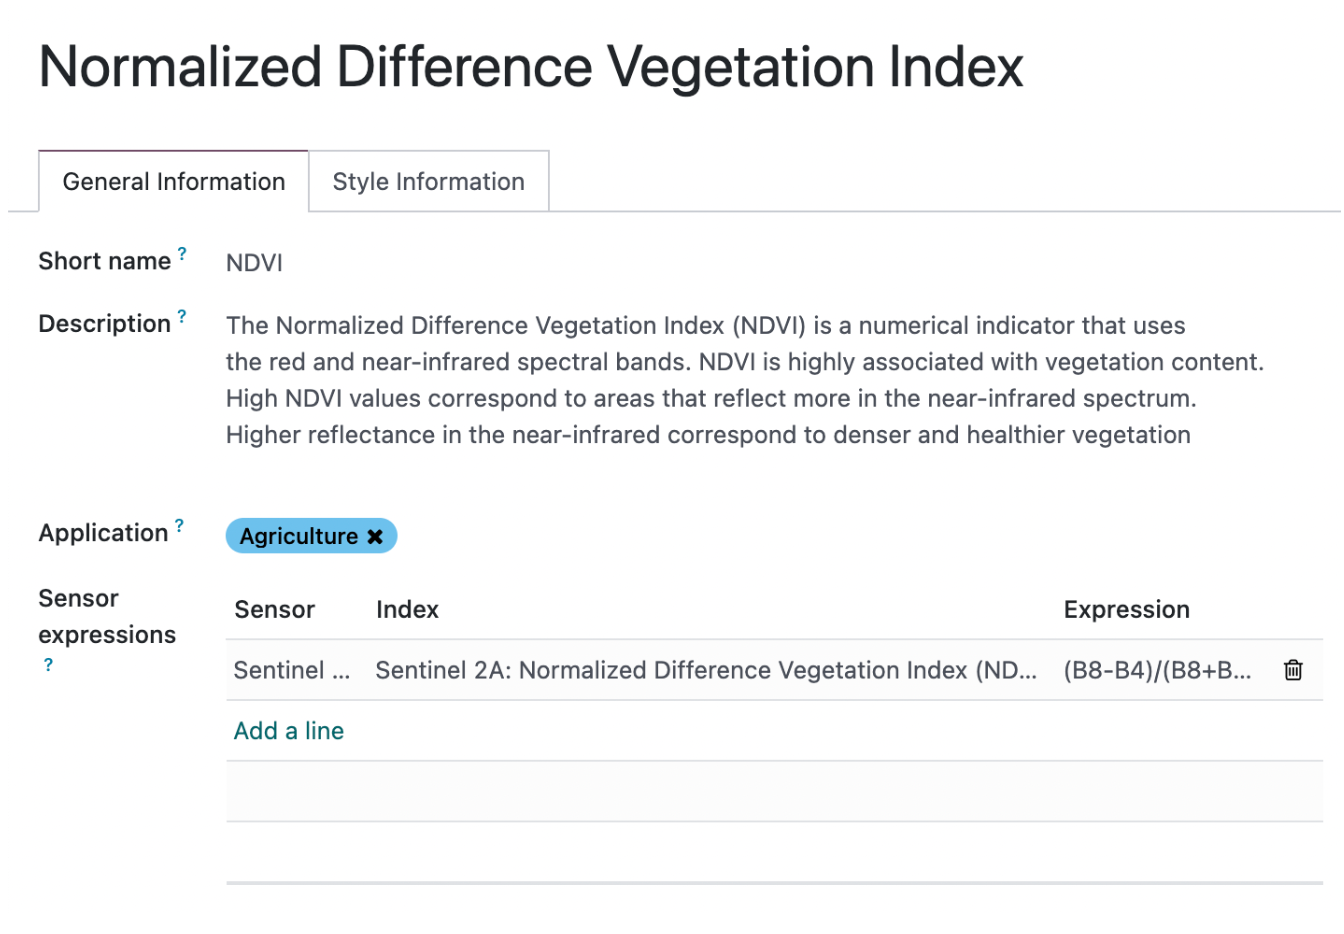
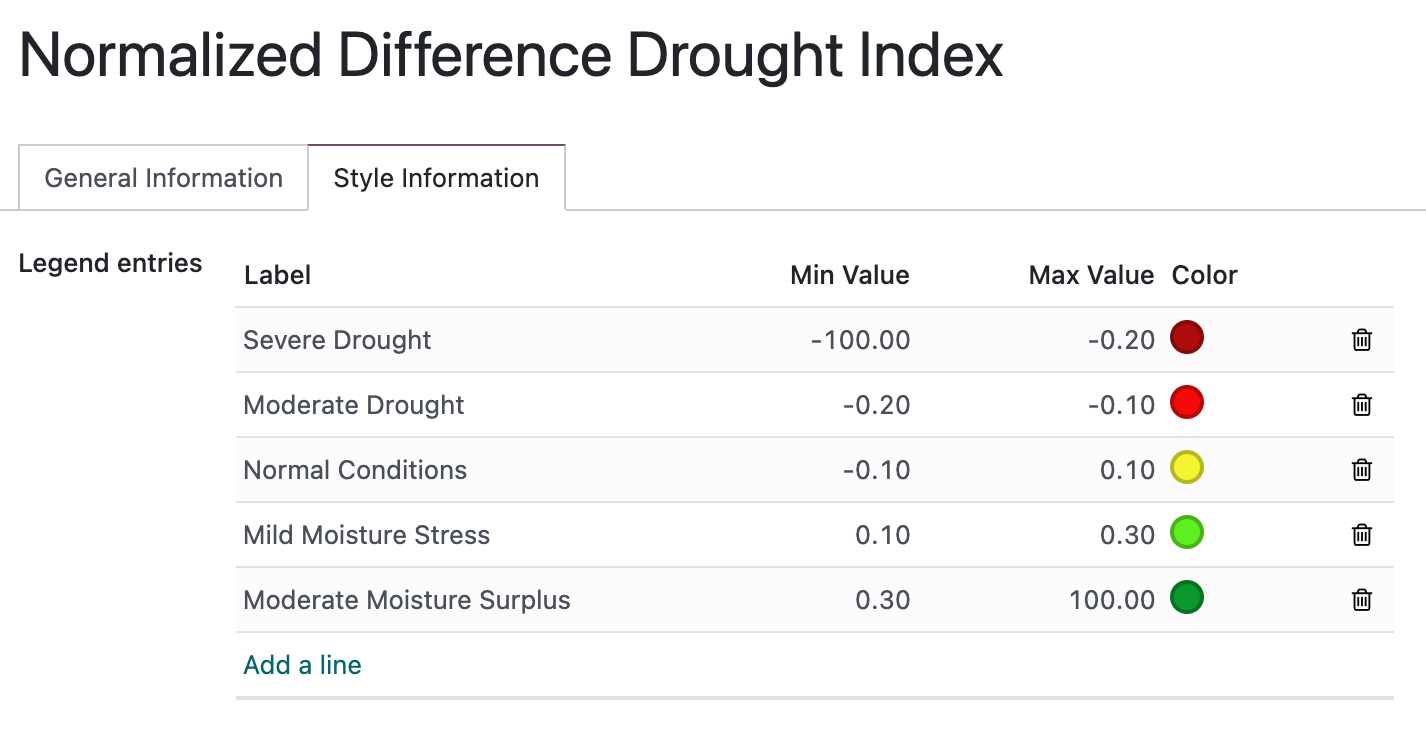
Create and customize spectral index style
Tool to create and customize the styles of spectral indices, as well as define other new indices, categories, sensors and colors.
Collect index statistics
A Mixin Model has been created and must be used with inheritance to allow the monitoring and the scheduled collection of index statistics in the module.
Once the model inherits the "monitor_model.mixing" two methods for collect data are provided:
- _collect_data: To collect statistical information about a index on specific date.
- _collect_previous_data: To collect data in the previous days passing the number of weeks to search for statistics.
A sample is stored for any geo object of the monitored Model with the mean, minimum, maximum, standard deviation, date and multi-spectral index that represents. This samples can be listed from the Module configuration menu.
Illustrative map for monitoring using multi-spectral index
The module allows users with the "Geoengine Administrator" role to add multispectral index expressions as raster layers in the Geoengine View and provide a way to perform visual inspection of index behavior. The map is rendered with a style based on the style defined in the index definition.
From the "Raster Management" form in the Configuration of the "Geoengine backend" the "GeoEngine Admin" can edit the desired GeoEngine View Data adding or changing expression layers.
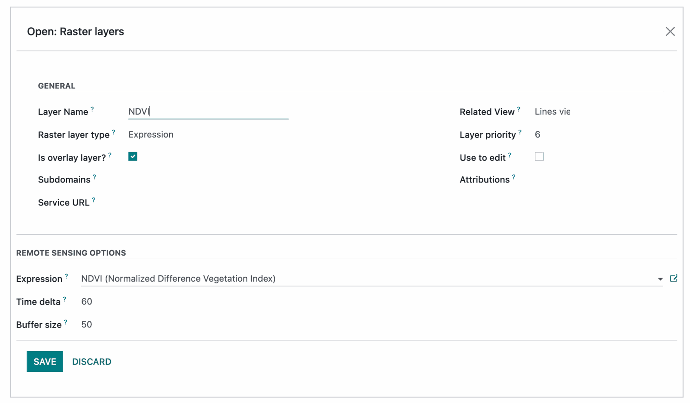
Tree properties have the expression layers, the index to show that mus be selected from the managed index list. The Time delta thats define the time windows searching for valid images, in terms of clouds free. And the Buffer size to define the influence area of interest to search for images and statistics.
The Layer defined in this dialog is shown in the GeoEngine View.
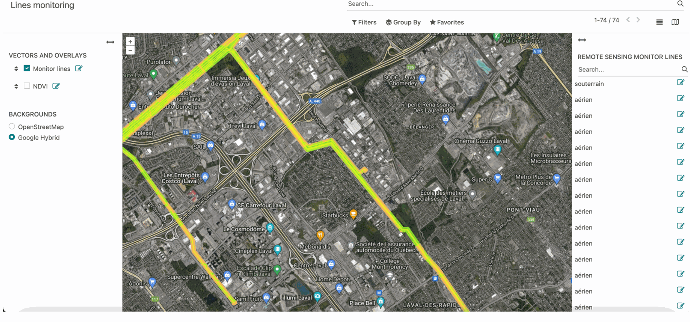
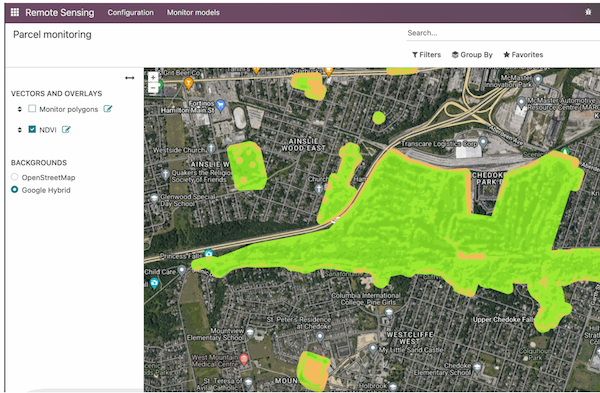
The layer visibility and the layer properties can be changed from the check button near to layer Name in the layers panel, on the left side of the map view. Also the Layers properties can be changed from the edit button in the layer panel for each layer.
The user can alternate between the background layers defined for the View when more than one is defined.
Perform Detailed inspection of Objects
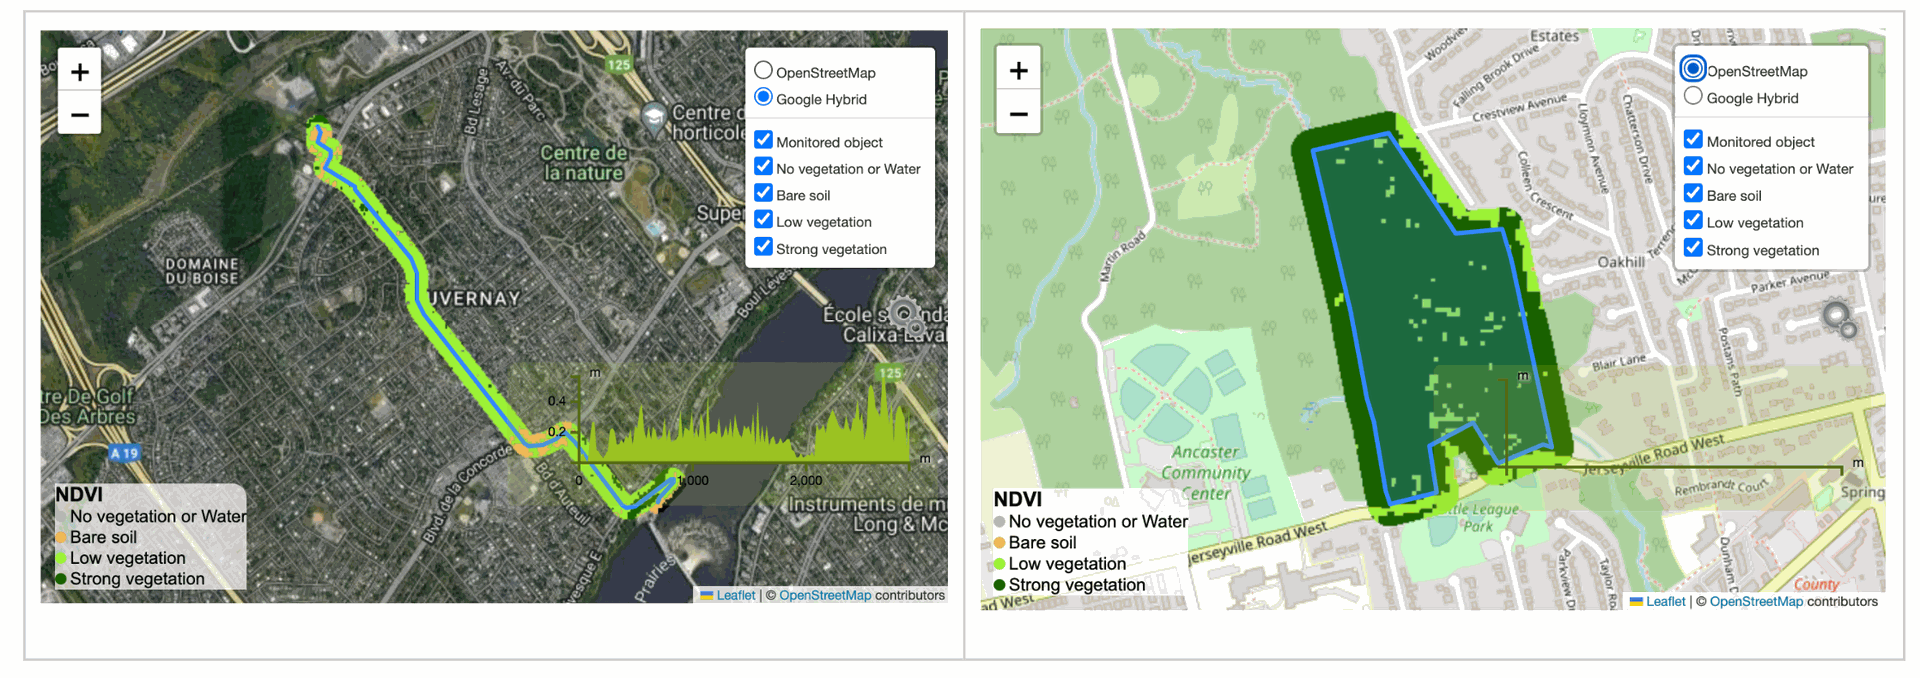
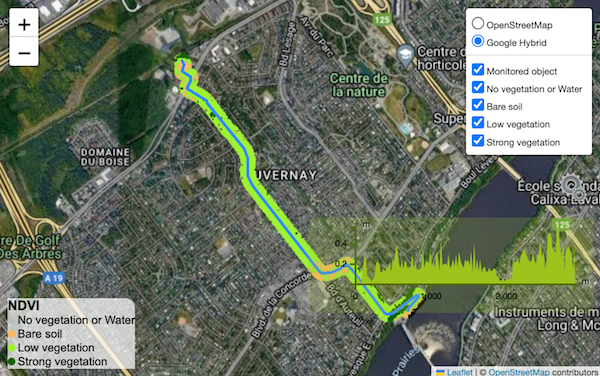
All objects being monitored collect statistics on the selected indices. These data can be inspected to analyze their variation over time. The main way to inspect objects is through their form view where in this module dow components are added to support the inspection of indexes.
The first component is a map where the selected index is added but decomposed as layers so that the user can turn them on and off as desired to achieve the analysis. Additionally, for linear objects, this component provides an interactive line graph based on the index samples under the object's geometry. By clicking on sections of the graph, the map focuses on the area of interest, facilitating the search for anomalies in the behavior of the index.